
Women in the Workplace: A Statistical Update for 2023
- JCI Blog
- Mar 22, 2023
- 3 min read

By Lindsay Turpin
It’s 2023, which sounds so futuristic, and yet we have so far to go in terms of equal pay and workplace equity. Examining the below statistics, it’s easy to become disillusioned with the state of the world, but we can see some hope: once women reach the place of leadership, they are more successful at instituting adequate benefits, healthy team dynamics, flexibility, and true equity for their workers. Through encouraging the rise of women as leaders and designing more humanitarian work environments, progress will be possible. But unfortunately, this is where we are right now.
The Impact of the Pandemic
At the start of the COVID-19 pandemic in 2020, unemployment was 4.1% higher for women, and it has not returned to pre-pandemic levels since then. This is perhaps because women had been employed in fields more exposed to the virus at the time of the outbreak.
The pandemic caused a larger decline in employment for women as a result of the pandemic: women’s employment levels dropped by 13.4% while men’s only dropped by 11.4%.
Employment for Asian and Hispanic women decreased by 17% and 16.2%, respectively, but was only 12.2% for white women.
Around 4-5% more women have been applying for remote work than men, according to LinkedIn data. Remote work may give more flexibility for child or elder care and other responsibilities, but it also reduces the amount of harassment and bias women deal with. But as written in a recent McKinsey report, “Companies cannot rely on remote and hybrid work as a solution; they need to invest in creating a truly inclusive culture.”
Salaries
On average, for entry-level jobs, men earn $64,022 per year while women earn only $52,266.
Women earn only 82 cents for each dollar that a man earns. Black women only receive 60 cents and Latinas only 55 cents for each dollar that a white man earns.
Men earned an average of 17% more in 2022 than women did.
In the same job sphere and experience level, women still receive 11% less money than men do.
Women’s salaries only surpass those of men for work as compliance officers, vocational nurses, and wholesale or retail buyers (and just by 2-3%).
Intersectionality
Companies that employ more women, particularly women of color, are creating healthier work environments with sufficient benefits like childcare and mental health support, proper training for managers, and flexibility in the work schedule.
Latinas and Black women receive the least amount of career support from their managers.
Asian women and Black women are not as supported by their teams, and are less likely to say they have been praised or advocated for by senior leadership.
Latinas and Asian women receive more offensive comments on their culture or nationality than others.
LGBTQ+ people & women with disabilities reported the most microaggressions and comments on their appearance.
Women with disabilities face questioning of their competence or judgment frequently, more often than other groups of women.
Titles and Career Trajectories
Only 8.8% of Fortune 500 CEOs are women.
In real estate, men earn 60% more than women. Women earn 59% less than men in the legal field. As financial advisors, women earn 58% less. Other roles with the highest pay difference include insurance agents, sales managers, and recreation workers.
41% of women of color declared an intention to be top executives, while only 27% of white women said the same thing. Despite a higher ambition level, women of color receive lower pay and less support from their employers than white women.
Women who hold leadership roles leave their companies more often than men, likely due to discriminatory environments. They have reported more often that coworkers suggested they weren’t qualified for their roles or assumed they were in a lower position. Women have also more often not received promotions or raises because of personal characteristics such as having kids.
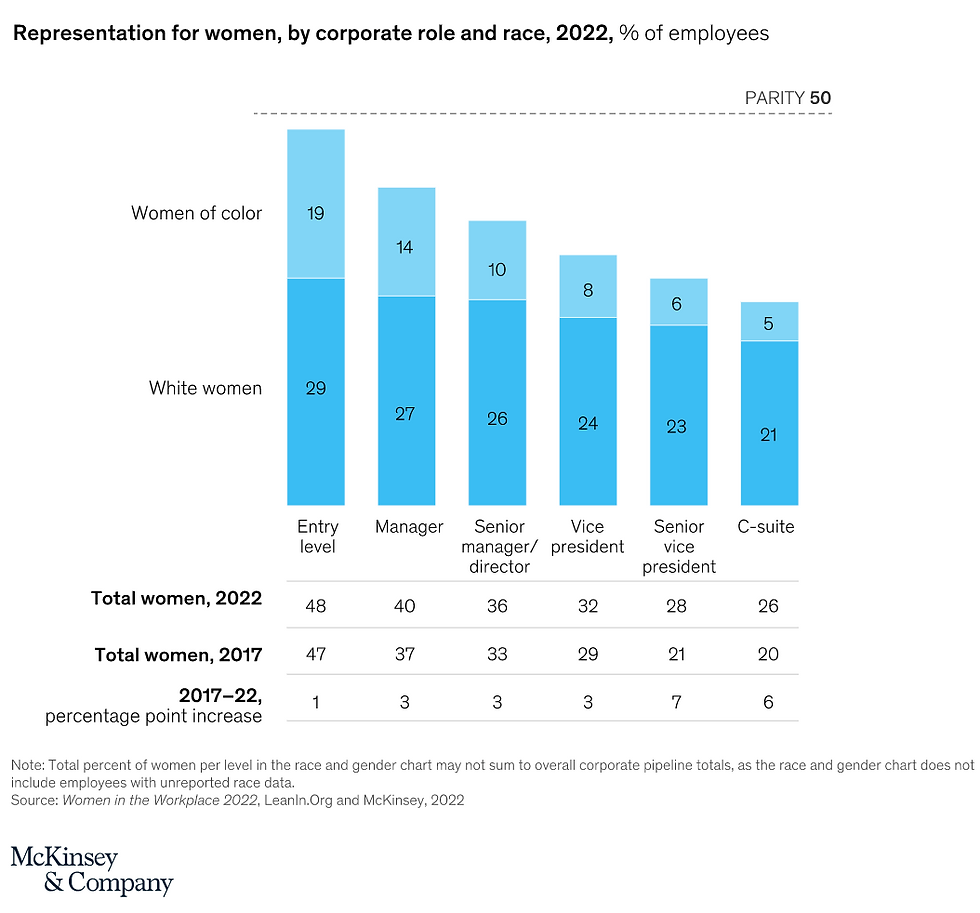
Data and graph by McKinsey & Co.
Sources:


Comments